The typical American household just had its best year on record. And the gap between the top and the bottom kept growing anyway.
Both of those statements come from the U.S. Census Bureau’s report on 2025, released September 15, 2026. Real median household income reached $87,460, up 2.6% from 2024 and the highest on record in data going back to 1967. The official poverty rate fell to 10.2%, and child poverty fell to a record low of 13.4%. U.S. Census Bureau, September 15, 2026.
That is genuinely good news, and anyone who tells you the American economy only ever gets worse is not reading the data. But look one layer down and a harder story appears.
The top keeps pulling away
Between 2024 and 2025, household income at the 90th percentile rose 1.7%. At the 10th percentile, it did not significantly change. That was the third straight year of gains at the top while the bottom stayed flat. Census Bureau, “Median Household Income in 2025”.
The Census Bureau tracks a simple ratio: how much a household at the 90th percentile earns compared with one at the 10th. In 1967, it was 9.23. In 2025, it was 13.06. A household near the top now takes in about thirteen times what a household near the bottom does.
The Census Bureau’s broadest summary measure of income inequality, the Gini index, was not significantly different between 2024 and 2025. Census Bureau, Income in the United States: 2025. So the gap did not explode last year. It held at a level far wider than a generation ago.
There is a second caution in the same report. The Supplemental Poverty Measure, which accounts for government benefits, taxes and necessary expenses like medical costs, stood at 13.1% in 2025, unchanged from 2024. By that fuller measure, the share of Americans struggling did not improve at all. The Census Bureau also noted that survey response rates remain below pre-pandemic levels, which can affect precision.
Health coverage tells a similar story. The same Census report found about 26.7 million people, 7.9% of the population, went without health insurance for all of 2025. For a family near the bottom of the income ladder, a single uninsured medical emergency can erase years of progress. Rising median income does not help much if one hospital bill can wipe it out.
Wealth is where the gap becomes a canyon
Income is what you earn in a year. Wealth is what you own: homes, savings, retirement accounts, stocks, businesses, minus debts. And wealth is far more concentrated than income.
According to the Federal Reserve’s Distributional Financial Accounts, in the second quarter of 2026:
- The top 1% of households held 32.5% of all net worth.
- The next 9% (the 90th to 99th percentile) held 36.4%.
- The 50th to 90th percentile held 28.8%.
- The bottom 50%, roughly half of all American households, held 2.3%.
Federal Reserve Distributional Financial Accounts, via FRED.
Now look at how that changed. When the Fed’s series begins, in the third quarter of 1989, the top 1% held 22.8% of the nation’s net worth. The bottom half held 3.5%. FRED, top 1% share; FRED, bottom 50% share.
In other words, over roughly 37 years, the top 1%’s share of American wealth rose by nearly ten percentage points, while the bottom half’s already tiny share shrank by about a third. The richest one percent now own about fourteen times as much of the country’s wealth as the entire bottom half combined.
Why inequality is a moral question, not just an economic one
The Moral Decay Index does not treat inequality as evidence that the successful are wicked. People who build businesses, work harder, take risks and save deserve to keep what they earn. A free economy will always produce unequal outcomes, and a country that tried to force everyone to the same result would destroy the incentives that create prosperity in the first place.
But inequality becomes a moral problem when the rules that produce it are not fair, and when the people at the bottom stop believing that effort pays.
Look at the other articles in this Index. A Puerto Rico Treasury employee admitted taking bribes to erase millions in taxes for people who knew whom to pay. Pandemic relief meant for struggling small businesses was, by the SBA inspector general’s estimate, drained of more than $200 billion in potentially fraudulent loans. Homelessness money in Los Angeles allegedly ended up in a nightclub. Every one of those stories is also an inequality story. When the connected can buy exceptions and the honest pay full price, the gap between them is not the product of merit. It is the product of corruption.
There is also the question of what concentrated wealth does to a democracy. When a small share of households controls a third of the nation’s wealth, their capacity to fund campaigns, lobbying and advocacy dwarfs that of ordinary citizens. That is not a conspiracy theory. It is arithmetic, and it is why transparency about political money matters so much.
What a fair response looks like
Reasonable people disagree about taxes, wages and the size of government, and they should keep arguing about them. But some principles should not be partisan:
- Enforce the rules at the top as hard as at the bottom. Tax evasion, fraud and bribery by the well-connected should be pursued as aggressively as benefit fraud.
- Measure honestly. Report both the good news in median incomes and the stubborn gaps in the Supplemental Poverty Measure and in wealth.
- Protect the ladder. Education, apprenticeships, affordable housing and access to capital are what let people at the bottom climb. A society that cares about fairness keeps the ladder in good repair.
- Keep political money visible, so economic power cannot quietly become political power.
The verdict
America in 2025 produced record median incomes and record-low child poverty. That deserves to be celebrated. It also produced a 90-to-10 income ratio far wider than a generation ago and a wealth distribution in which the bottom half of the country holds 2.3% of the nation’s net worth.
A country can be richer than ever and still be failing the test of fairness. The question is not whether some people should have more than others. It is whether everyone still has a real shot, and whether the rules are the same for everyone playing.
Sources
- U.S. Census Bureau, “Income, Poverty and Health Insurance Coverage in the United States: 2025,” September 15, 2026
- U.S. Census Bureau, “Income in the United States: 2025” (P60-289)
- U.S. Census Bureau, “Median Household Income in 2025 Surpassed Previous Highs,” September 2026
- Board of Governors of the Federal Reserve System, Distributional Financial Accounts, Q2 2026 release tables (via FRED)
- FRED, Share of Net Worth Held by the Top 1%
- FRED, Share of Net Worth Held by the Bottom 50%
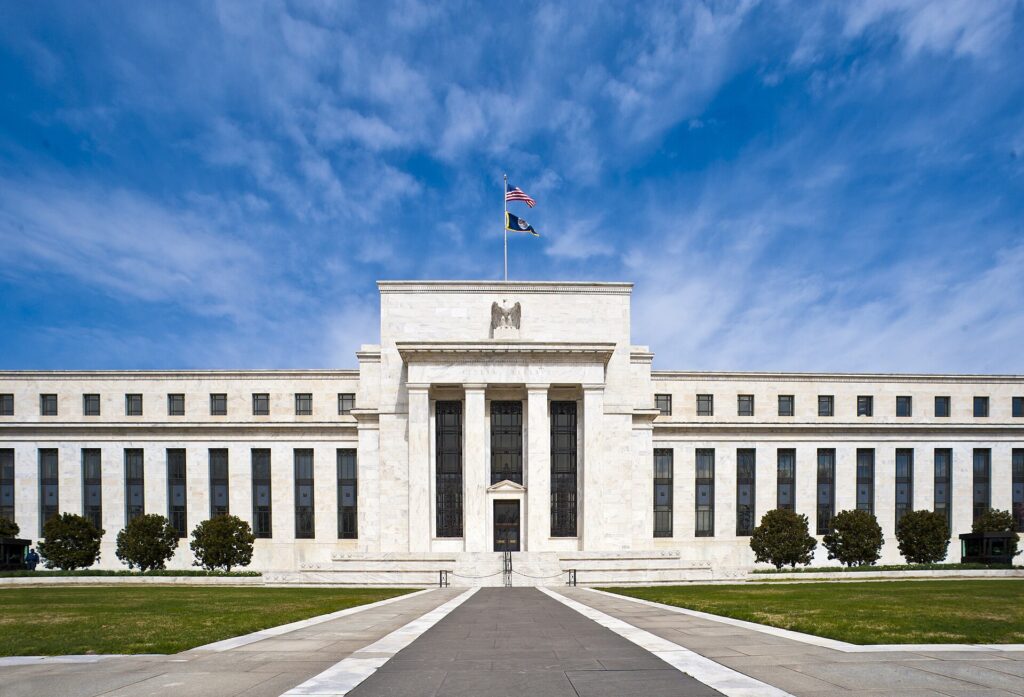
Featured photo: Eccles Building, Federal Reserve Board, Washington, D.C. Federal Reserve, public domain, via Wikimedia Commons.
If this made you angry, good. Now turn it inward. The Moral Consistency Journal is a 30-day audit of the places where your own standards bend. More Case Files and data breakdowns live at themoraldecayindex.com. Books that go deeper are in our Bookshop.org store, which supports independent bookstores.